A Postcard from a Bitcoin Low
Bitcoin's sitting more than 50% under its Power Law trendline. Here's how long the discount might last — and what an extra $100 buys before it ends.
Bitcoin and Nostr don't need another DCA calculator. I know that. But it's June 13th, and the SpaceX IPO has people deciding between chasing that and stacking sound money, while Bitcoin just printed a fresh low near $61.5K. The headlines called it ugly, the FUD is real, but the trendline says sats are on sale. Here's what you're about to read.
Part one. We're a long way under the Power Law trendline right now, far enough that climbing back takes time. I had Claude and ChatGPT run that catch-up separately, and I'll show you where they agree and where they don't.
Part two. A calculator, because this is a fun thought exercise and maybe a tool that's fun to play with. Bitcoin's on sale, so what if you stacked an extra $100 — a month, a week, or if you can swing it, a day — and kept it going until price climbs back to the trendline? I ran all three, just to show how much a person can pile up in a window like this.
That's the whole idea. This is a good summer to be hustling.
Maybe you'll find it useful. Maybe you'll skip it. It was fun to build, and it came together fast on the new Claude Fable 5 model, which still surprises me.
Two AI Models, One Trendline: How Long Does the Discount Last?
Bitcoin topped near $126K in October 2025. Since then it's fallen again and again. On June 10, 2026, we printed a fresh low around $61,500. That's half the paper value gone in eight months.
So what does that mean for the Power Law trendline? Two AI models, Claude and ChatGPT, got the same question independently. Same data, same starting point, no peeking at each other's homework: we're way below the trendline right now. If the line holds, when do we get back to it?
Before the answers, here's the thing. This is technically a price model. But that's not what it's for.
What it really measures is time.
How long does Bitcoin stay below its trendline, and what does that window mean if you're still stacking? If you believe the line holds, time below it isn't bad news. It's the sale. The model just tells you how long the sale might run.
That reframe changes how you read everything below.
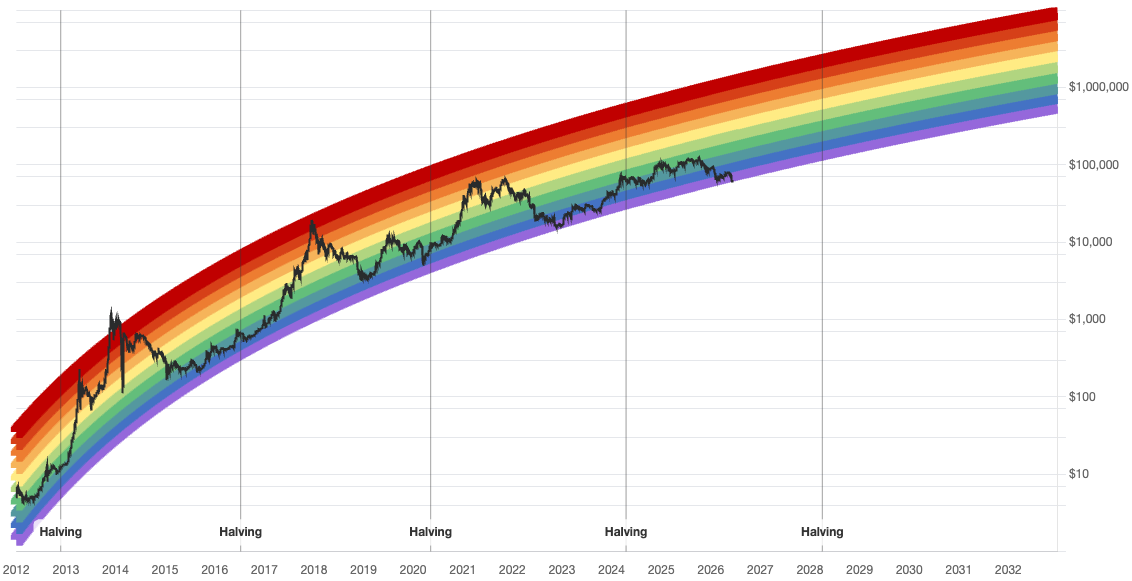 blockchaincenter.net · the version most people have seen open →
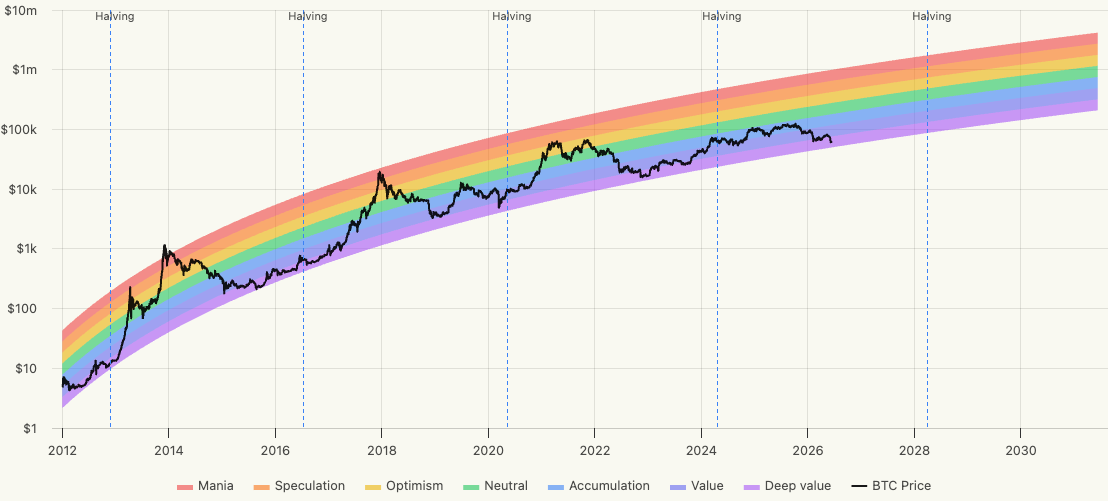 Bennet.org · my favorite Bitcoin site, far and away open →
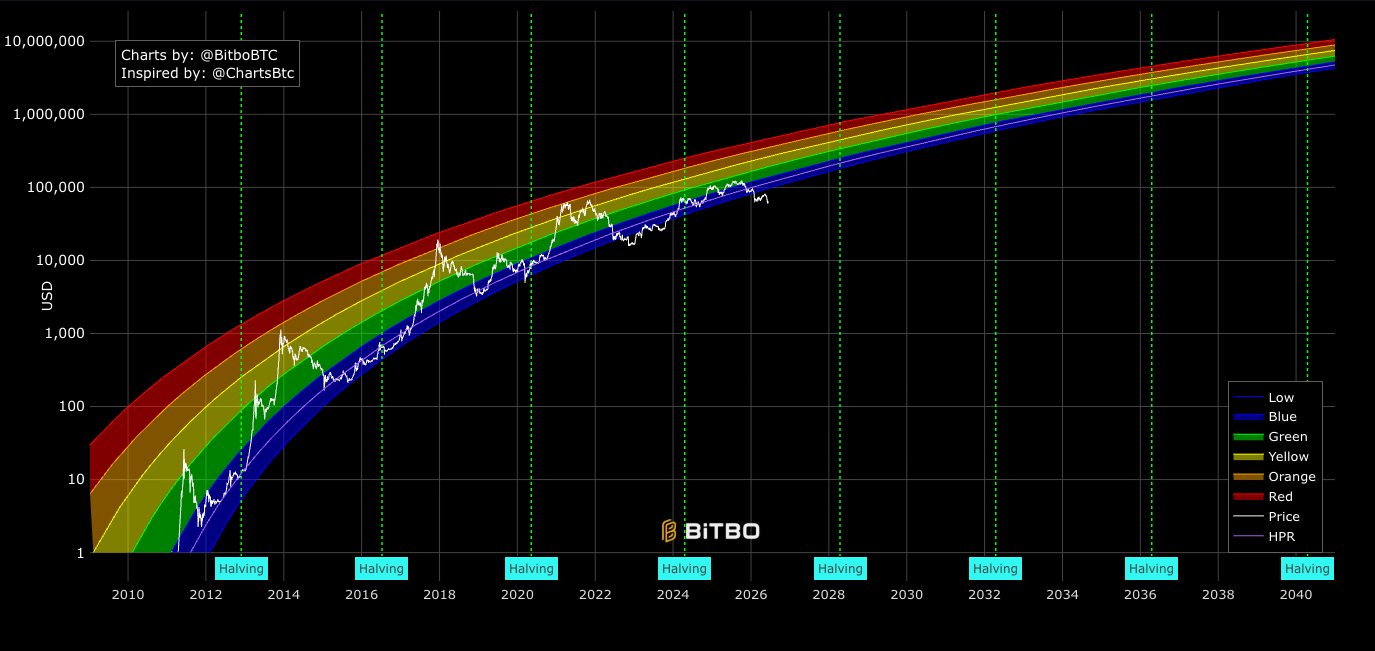 charts.bitbo.io · dark mode, updated hourly open →
Where they agreed
Almost everywhere, honestly.
- Same anchor. Both started at $61,500, a spot price from June 2026.
- Same trendline. Both put the Power Law 1.0x line near $133K at the time.
- Same multiplier. Spot's sitting at 0.46x of trend. Deep below the line.
- Same verdict. The Power Law didn't break. The old assumption that we'd be back on the line by mid-2028 did. Both models said the same thing: keep the equation, re-anchor to the current spot, move the dates.
- Same worst case. Both landed on the exact same slow-recovery date, December 31, 2030. Not close. The same day.
Two honest caveats before you lean on any of it. Two models fed the same setup landing on the same date isn't proof it's right — it's a sanity check, and a read on how wide the range really is. And the Power Law is a useful prior, not a law: fifteen years of fit on a chart that flatters almost any rising line, with a real chance of breaking.
Where they split
One difference showed up everywhere. ChatGPT put every recovery date about six months later than Claude.
Same scenarios, two clocks:
- Bull case: Claude says December 2027, ChatGPT says June 2028.
- Base case: Claude says December 2028, ChatGPT says June 2029.
- Bear case: both say December 2030.
How realistic are the fast lines? The last recovery — November 2022 to March 2024 — ran faster than either one even needs, but it launched off a confirmed bottom, and we don't have one of those yet. Even so, the most optimistic line still admits about eighteen months below the trendline — they're arguing about how long the window stays open, not whether it's open.
The discount window, measured
This is where the reframe pays off. Run every scenario from both models and ask one question: how long does spot stay in each zone below the trendline? Bars are to scale — the full width is the 55-month bear.
So here's where I land, at the end of a rough week in a rough year.
The fire sale is short. The discount is long. And the slowest recovery is the cheapest stack.
If you believe, this isn't the season to doom-scroll. It's the season to do the work that finds you more fiat to stack while the multiplier is this low.
And if you want to see what that stacking actually does across these four windows, keep scrolling. The calculator is right below. Pick a number and look.
The Longest Sale Buys the Most Sats
So now we know the shape of the discount. Let's run a DCA calculator — the kind we've all run before — but start it here, to see how much we can stack while the sale is on.
Let's say that starting July 1, 2026, you add an extra $100 to whatever you already stack. A month, a week, a day — your call. And you keep that extra going until spot climbs back to the Power Law trendline. Two AI models drew four glide paths back to the line, so there are four ending dates: December 2027, December 2028, June 2029, and December 2030.
Same anchor, same trendline, same math as the chart above. No spreadsheet required. Pick a number and look.
How the math works
- Both AI models anchored at June 10, 2026: spot $61.5K, trendline $133K, a 0.46x multiplier.
- Each scenario glides that multiplier smoothly back to 1.0x by its catch-up date. Spot on any day is the multiplier times the trendline.
- Your extra $100 buys at that day's spot price — monthly on the 1st, weekly every seven days, daily every day — starting July 1, 2026, and ending the day the line touches trend.
- On day one, July 1, 2026, that spot price sits around $63–64K depending on the scenario, since each glide path has climbed a little off the June 10 anchor at its own pace, against a July trendline of $135.5K.
- The stack's final value is your Bitcoin times the trendline price on the catch-up date.
What this isn't
A prediction. Real prices will chop above and below every line here, and your real buys will land all over that chop. This is a deterministic toy built on smooth glide paths, so the numbers are exact for the model and approximate for reality.
It's also not a dare to stack more than you can. The tool works the same at $100 a month or $20 a month. The point isn't the size of the number, it's seeing what time under the line does when the number is honestly yours.
And let me read the obvious out loud, because the page keeps not saying it: stacking into a 50%-off market means buying something that is, right now, falling. It can fall further, for longer than this model thinks, or the model can be wrong about the whole thing. Only stack money you won't need for years and can watch go redder before it goes anywhere. The discount is real and so is the risk — they're the same sentence.
Some things to check out this summer
Things I keep sending people. None of them are mine, and none of them pay me.
BIP 110
The most important thing happening in Bitcoin this summer — a contested soft fork over what belongs in a block. I'm a proponent. If you only go down one hole, make it this one.
Bennet.org
The best Bitcoin site I've found in years — the Rainbow Chart lives here too. Start with his plain-English guide to what Bitcoin actually is, then wander.
Pool mining, explained
nomadshiba's guide to pool mining is the clearest walkthrough I've read. Published on Nostr, where it belongs.
Rent Some Hash
Renting hash rate gets talked about a lot, but nobody shows you how to actually do it. This resource is awesome.
Sound HSA
If you're in the US and qualify for a health savings account, you can stack it in Bitcoin. Worth twenty minutes of your time.
AI Made Easy with Matt Hill
The Start9 founder teaching hands-on AI at The Space in Denver — OpenClaw and more. Both sessions are up.